📋 Project Report Out Database
What Is It?
The Project Report Out Database is the file where all Project Report Outs (PRO) are stored. It provides you a company level overview of the financial situation of all your projects based on their last received PRO.
Key Concepts
Project Report Out
The Project Report Out is a project update that Project Managers send on a regular basis. In Conduite, they are expected to send it twice a month on every 2nd and 4th Thursday.
The PRO is sent from the Project Dashboard of a project and contains the main project KPIs as well as narrative components that detail was was done in the previous and upcoming project periods.
| Field | Description |
| Project ID |
This is a unique identifier for the project. This is the ID of the Google Spreadsheet file. 💡This field is preloaded. |
| Project Name |
The name of the project 💡This field is preloaded. |
| Project Status |
A traffic light indicator that reflects the current overall status of the project. Tip: Make sure to set a clear definition for each color in order to have consistence across PROs and projects. |
| Labor - Execution Rate |
The current Execution Rate of the project. 💡This field is preloaded. |
| Labor - Execution Efficiency |
The current Execution Efficiency of the project. 💡This field is preloaded. |
| Expenses - Margin Accrued |
The current Accrued Margin on expenses of the project. 💡This field is preloaded. |
| What happened in the last 2 weeks? |
A summary of what has been done in the last 2 weeks or since the last PRO was submitted. Tip: Make sure to include any context that helps understand the values of the project KPIs. |
| What is planned for the next 2 weeks? |
A summary that details what the project team expects to do in the next 2 weeks. Tip: Make sure to include any strategy adjustment details. |
Key Performance Indicators
Labor - Execution Rate ⭐
The Execution Rate (%EX) is a financial indicator that tells you how much (%) budget you've spent to date related to the amount you think you need to execute the project, i.e. Expected Execution Budget.
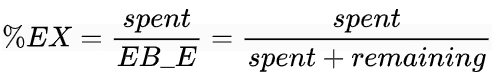
It is not (exactly) an indicator of progress of execution of project activities, i.e. it does not tell us if the project is close to completion. Ex: the last activity of the project is a one week training. This activity represents 30% of the budget but only one week of work.
Labor - Execution Efficiency ⭐
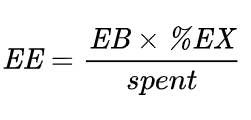
The Execution Efficiency (EE) is a KPI that tells you whether your team is on track to be in budget or not. In other words, whether the team will meet its Margin Objective on labor.
It compares how much labor you would have spent of the Execution Budget (EB) based on your current Execution Rate (%EX) to what you a have spent to date.
Project teams should manage their project to achieve and Execution Efficiency 100% or above.
Because it is a percentage, you can instantly assess the financial health of a project, regardless of the Margin Objective.
It is the main KPI that allows you to trigger adjustments of strategy and/or objectives (client approach, margin, scope, ...).
Interpretation
- EE < 100% - The team will spent more money than expected and the margin generated will be lower than the objective.
- EE = 100% - The team will spent as much as expected.
- EE > 100% - The team will spent less money than expected and the margin generated will be above the objective.
Examples
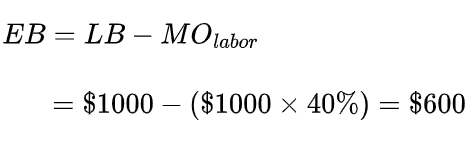
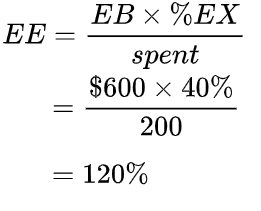
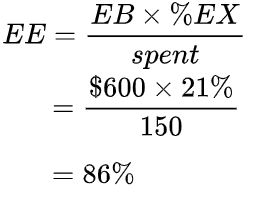
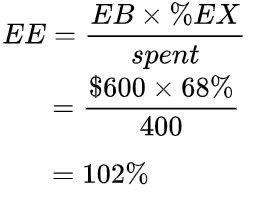
Let's consider a project that has a Labor budget (LB) of $1,000 and a Margin Objective (MO) of 40%. The resulting Execution Budget (EB) is:
Let's consider the following scenarios:
| Scenario 1 | Scenario 2 | Scenario 3 | |
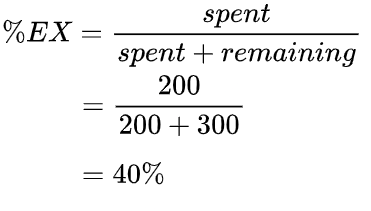
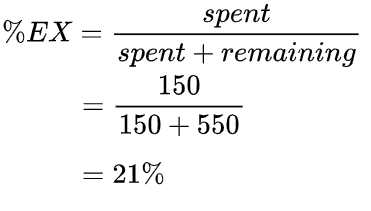
| spent | $200 | $150 | $400 |
| remaining | $300 | $550 | $190 |
| Execution Rate (%EX) |
 |
 |
 |
| Execution Efficiency (EE) |
 |
 |
 |
Let's analyze these numbers and discuss possible actions:
| EE | Status | Possible Actions | |
| Scenario 1 | 120% | 🎉 |
|
| Scenario 2 | 86% | 🚨 |
|
| Scenario 3 | 102% | 👌 |
|
Expenses - Accrued Margin
Expenses - Margin Accrual Efficiency ⭐
Using The Application
Typical Workflow
- You open the PRO Database tab and filter the list to display only the last PRO. That gives an overview of the financials for all your projects.
- You open the Project Sheet tab in order to dive deeper into a specific project and appreciate the trends of its KPIs.
Structure & Features
PRO Database
This is a read-only (protected) tab. Do not modify it.
This tab displays the main fields of a PRO. Some fields are hidden to make the table more readable. If you want to see the full details of a PRO use the menu 🐙 Conduite > 📄 View Full PRO.
| Field | Description |
| Date |
The date the PRO was sent and received. |
| Project Name | The name of the project |
| Status | The status of the project at the time of the PRO. |
| LB - %EX | The Execution Rate of the project at the time of the PRO. |
| LB - EE | The Execution Efficiency of the project at the time of the PRO. |
| EP - %AM | The percentage of Accrued Margin on expenses of the project at the time of the PRO. |
| EP - MAE | The Margin Accrual Efficiency on expenses of the project at the time of the PRO. |
| Last PRO | An "X" sign tags the last PRO of a project. |
| PRO Age | The age of the PRO in days. Ex: 21 means that the PRO was received 21 days ago. |
Project Sheet
This tab allows you to deep dive into a project data over time. Use the Project dropdown to select the project of interest.
The tab is composed of several sections.
| Section | Description |
|
Last Project Report Out |
A table that displays the KPIs from the last PRO of a project. |
|
Evolution of Project KPIs (Chart) |
A chart that show the evolution all project KPIs over time. |
|
All Project Report Outs |
A table that displays all PROs for a project ordered by ascending date. This is the source of the chart. |
Configuration
This tab contains the ID of the Conduite configuration file and other computed configuration parameters.
Conduite Menu
View Full PRO
This menu item opens a detailed view for a PRO in the sidebar. You need to be on the PRO Database tab to use this feature and to select any cell of an opportunity before triggering it. The sidebar will display the details for the selected PRO.
Filter > Show All PROs
This view is useful if, on a specific occasion, you want to browse through all PROs.
Filter > Show Last PROs Only
This is the most useful view for the day-to-day use of the PRO Database.